This is not going to be a brief history of AI development and how it impacts knowledge workers especially in the technology industry. I am going to jump directly to how it has impacted me. I am a Data Analyst by profession. The first time I experienced the “magic” of AI was when I created my OpenAI account, in early 2022, just to see what all the hype about “ChatGPT” was. I was blown away. So much so that I started using it regularly for coding projects and writing code for automating a lot of boring stuff in my job. I started reading articles about Sam Altman and watched him rise into the zeitgeist as some kind of a “prophet”. I was impressed with the guy. I gradually started using ChatGPT for pretty much everything: cooking recipes, career advice, opinions, research, advice, ideas…
Then came the AI hype storm. 2023 and all anyone could talk about was AI. Roughly mid year 2023, and pretty much every third software service provider was selling some kind of “AI” based product. Every week there was a new model coming out from the MAANG companies. Some open source, most closed. Every week there was some new benchmark test bragging about the strength of one model over the other. By the end of 2023, I felt that I had missed the AI Hype train. Then came the LinkedIn posts, the YouTube shorts, the tutorial storm, the courses…
2024 and I had started feeling a little worried. Senior leadership in my company had started talking about “AI”. There was no meeting in which AI was not discussed. Everyone was talking about it. No one had a clue about how to incorporate it. Including me. No shame in admitting it.
The latter half of 2024, I lost my job, along with many others. Cost cutting measures, we were told. But to be honest, the AI hype had derailed our product offering to the world. Because now everyone wanted to do “something with AI”. While not a direct loss, I had lost my job to AI. In a way. At the same time, while job hunting, I was using AI to sharpen my skill set, learn new technologies, write blogs, develop projects, prepare for interviews, modify my resume, build cover letters. AI was helping me find a job and land interviews. I was also slowly realizing how powerful this tool was.
In the right hands, AI is an incredibly powerful tool. In the wrong hands, AI is an incredibly powerful weapon. Very generic statement, but it’s the truth. But let’s come back to my little world. What really worries me is that companies are going to use it to automate everything. But the true control of the tool will be limited only to a few companies. Everyone else, will depend on them. These companies are OpenAI, Microsoft, Google, Amazon and Meta. Open source models will give us some home but not for long. Leaders of these companies will keep echoing the optimism that AI will change the world for better. People like Sam Altman will continue to say an optimistic thing one day and a pessimistic thing another day. We will continue to hope that AI will change the world for the better. For some time.
While I do see how incredibly powerful it is, AI tools don’t seem to be solving our biggest issues. Or atleast no one is interested in solving the big problems using AI. I don’t hear about a any new models being trained to detect cancers or identify new chemicals or solve healthcare insurance problems or identify the best way to reforest land or identify new ways to build buildings etc. All I hear or read about is how AI can do your job better. Or how one can use AI to earn money. Or how companies can use AI to save money. Money. That is all I ever hear about.
I am not worried about “the singularity”. I think it is a very vague term. I say, let it happen. Let it come. Sooner than later. Let there be a “sentient” AI. Let it happen now rather than when we are all dependent on AI for all our knowledge needs. Will it be the end of us? I don’t know. I hope not. Will it save us? I hope not. I think we should be able to that ourselves. Also, it doesn’t seem so.
But, can it help us? Can it help us be better? I hope so.
Disclaimer: I have taken the help of ChatGPT to describe some of the more technical concepts in this write up, like definitions and explanations. Everything else, are my words.
In this series of posts I will try to build out a toolbox for data analysts. A basic understanding of statistics is critical for any data analyst or data scientist. While statistics as a subject is vast and capable of inducing cold sweats in most people due to its seemingly complex nature, it is also misunderstood and perhaps the most used concepts are simple enough for a person with basic math skills.
For example, today’s topic of basic descriptive statistics. Mean, median, mode, range, variance and standard deviation. For a given dataset, and for a single value:
Mean: The average of a dataset.
Median: The middle value of a dataset.
Mode: The most frequent value in a dataset.
Range: The difference between the highest and lowest values.
Variance: A measure of how spread out the values are.
Standard Deviation: The square root of the variance.
These terms are pretty self explanatory. But Variance and Standard Deviation may need more explanation. Here are the definitions in a bit more detail.
Variance
Definition: Variance is a measure of how spread out the values in a dataset are around the mean. It quantifies the extent to which each number in the dataset differs from the mean.
Standard Deviation
Definition: Standard deviation is the square root of the variance. It provides a measure of the average distance of each data point from the mean and is expressed in the same units as the data.
How to calculate?
These metrics are extremely easy to calculate with a simple python code. In my example here, I am using the House Prices dataset downloaded from Kaggle. The column in the dataset we are analyzing is: SalePrice which is the price of the house. The python code, which can very easily be generated by ChatGPT. Here is an example:
Descriptive statistics may not be as “fancy” or “complex” as other statistical methods but they are crucial. For example, the mean value of a dataset can give us a fair idea of what the data looks like. Specially useful in pricing and sales. For example, in my job, I use these measures for understanding the price of our product offering as compared to other similar products. Median and Mode are also helpful in understanding where our product price lies if I were to lay down all similar products in the market on a table in front of me. Are we close to middle or are we too pricey.
One thing to take note is the word “similar”. When I say “similar” products, its important to understand what that means. Lets say we are trying to understand better if an online course I am selling is priced correctly or not. If I compare all available courses online (irrespective of what the course topic is) then my descriptive statistics will be misleading. Not all courses are created equal. Not all courses deliver the same value. And I cannot really compare a course which teaches you a technical skill and a course which is soft skills focused. The average price for my technical course may be too low (or too high).
While an AI tool can help you write the code, its in the data gathering phase where a human intellect is required. For these descriptive statistics to make sense, we must compare similar courses. And the “similarity” can be a complex. How deep should I categorize the data collection ? Should I look at all course prices of the same subject? Or should I look at all course prices of the same topic?
Inversely, if you already have a dataset, then these statistics can be used to understand the quality of the data. For example, continuing with our online course prices example, if the median and mean have a massive difference, then we are probably looking courses which are vastly different. If the variance or standard deviation of the course prices is too high, we are either looking at very different courses or we have an error in our data or we have an “outlier”. So these descriptive statistics can be used as a data quality measurement tool as well.
Results
From a house prices perspective, these results look accurate. The mean and median are not “wildly different” suggesting a uniform dataset, perhaps house prices from a zipcodes not too far from each other.
The high value of the range suggests that cheapest and the most expensive house have a massive difference, which can be true. But this is something to investigate.
The standard deviation is also high suggesting that there is either a big difference between the house prices or there are certainly some outliers. Further investigation is required.
Whats next?
I would probably do a histogram of the prices to understand how the dataset looks like. I already did and here are the results.
Looks like we have a significant number of houses which are above 200K . There is greater variability in prices above 200K suggesting that could be the reason for the high standard deviation.
Hopefully this was brief enough and useful enough! See you in the next one.
More Use Cases (Thanks ChatGPT!)
Finance:
Variance: In finance, variance is used to measure the volatility of a stock’s returns. A higher variance indicates a more volatile stock.
Standard Deviation: Standard deviation is used to gauge the risk associated with an investment. A higher standard deviation means more risk as the investment returns are more spread out from the mean.
Quality Control:
Variance and Standard Deviation: In manufacturing, these measures help ensure product consistency. Low variance and standard deviation indicate that the product quality is consistent, with minimal deviation from the desired specifications.
Healthcare:
Variance and Standard Deviation: In medical research, these measures help analyze the effectiveness of treatments. They can indicate how varied patients’ responses are to a treatment.
This is not a video review. Although it may sound like it at times. This video is about how automation is changing the world today. There is a comparison to historical times and an explanation to why things are different today. The examples are very limited in scope but I for a short video like this one, they are impactful.
This video presents an ominous picture of the future. However, I agree with it more than I disagree. I work in the technology industry as a data analyst/data engineer and every month I am handed a project which involves the automation of some functionality. I am not even talking about the automation as explained in this video (machine learning). The automation I develop is simple code or by use of tools which eliminate the need for a human being to press a button or even open the file. It’s been two years and I have automated numerous such processes saving many hours or boring monotonous work. It’s after working on projects like this that I slowly start to realize that certain functions of my work can be automated too. (Chill runs down the spine).
The truth is, that there is no clear answer to the question: Will we all lose our jobs to the robots? .
People have ideas but they are untested. Tech companies do not even want to try to answer the question as they will fall behind the race to create the smartest machine in the world if they pause to ask this question. Governments seem to be oblivious to the problem and the alarming number of graduates taking up low skilled jobs doesn’t bother them; at least they have a job.
After watching the video, I went into a micro panic; I typed the following words in the YouTube search bar: FIGHT AGAINST AUTOMATION. The only videos I found were mostly media house produced videos about the very question I have mentioned above, news articles and university videos about how to IMPROVE automation (WTF!). There were no independent videos of people seriously thinking about the question. There was one video:
177 views + 1 (mine)
This was particularly scary for me because I thought that I would find tons of videos of YouTubers ranting against automation and thinking of ways to fight back to protect professions or atleast thinking of ideas to help people stay employed in the future but … nope. No angry YouTubers here. Only rich business owners talking about why their hands are tied:-
“I don’t want to do it but I have to do…nothing personal”
All this is not immediately worrying for me. I am a male with a master’s degree and technical skills sitting in front of a laptop. I order my food online. I am a beneficiary of this wave of automation which is sweeping the low skill work market. I cannot empathize with a server in a fast food joint or a worker in a grocery store. But in my own industry I have seen jobs disappearing. There was a time when software testers used to be in demand. I myself had thought of learning extensive software testing (in depth) in the past. But today, I rarely see any jobs for software testers. I do see automation engineering positions a lot though.
Conclusion:-
My fingers are tired. “Hey Google, can you please take this down for me? ”
We are benefiting from automation. But we are also blind to its pitfalls. The lack of voices out there screaming about the challenges automation poses to our collective future is alarming but this picture can be changed. And I think we are moving in the right direction. Although I am afraid our speed is slow.
First, we need to make the effects of automation known far and wide. The word is not out there yet. Also, we must realize that automation is not taking a bottom up approach. It’s is taking a bottom-up, top-down and middle-up-down approach, all at the same time. It is happening in all levels of the corporate hierarchy. So if you are reading this on your computer or mobile screen, start thinking about how this can impact you and your future.
The objective,is to build a model which is able to predict if a particular station will run out of bikes within two hours. If the model is able to predict this with reasonable accuracy, it is possible for the bike sharing company to replenish the station with more bikes.
If a station requires bikes, an alert message can be sent to a central command center which can then dispatch a truck/vehicle carrying more bikes to replenish the station which sent the alert.
Since there are a number of stations, the model has been built on the station with the highest traffic. It can then be applied to all the other stations or to high volume stations if required.
Data Set Information:-
The data set includes the following files.
Station.csv : Contains station information like name, location and number of docks available (70 rows)
Status.csv: This is sensor data for every minute for each station. It shows the number of bikes available at the station at that minute (72 M records)
 > station_id
 > Bikes_available
 > Docks_available
 > Time
trip.csv: Contains trip related information for each station (670K Rows)
weather.csv: Contains weather related data for each day for each zip code (3665 rows)
The data set is quiet large (approximately 660MB), which is why its a good data set to experiment with pyspark. Because I have worked on a single machine instead of a cluster, I have used basic pyspark here to read and extract the data.
Remark on Data Quality:- The data quality was generally good. However, the time stamps were inconsistent in a few places. The weather data also had some incorrect values in columns which were handled.
Methodology
Approach
We begin by combining the data as the relevant information is present in a number of different data sets. The station table contains station information which acts as a key to identify station specific data from the status table and the trip table.
Why just one station ?
Since the data set is a large one, and not all stations have similar traffic, we identify the one station where we can check our methodology. Eventually, we can apply the same methodology to other stations.
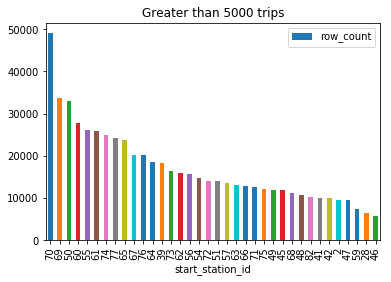
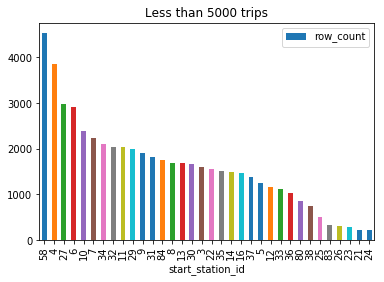
Station 70 has significantly higher number of trips than any other station A large number of stations have less than 5000 trips over the time period (2013-2015)
Since every station has different amounts of traffic, I haven’t explored a strategy where all the station data is taken together, however this can be done if we have a cluster of machines or multiple nodes. But I believe the best approach will be to take the highest volume stations together and the lowest volume stations separately. In low volume stations, maybe such a prediction may not work.
Building the parameter which will be predicted
A parameter called Replenish is introduced. This parameter is set to 0 (which means that the station does not require additional bikes at them moment), based on the available number of bikes in the station. If the available number of bikes is less than 4, then the parameter is set to 1, which means that the station needs additional bikes.
The parameter has been created by looking forward in time by 1 hour for our historic data set. If in the next one hour, the number of cycles available is less than or equal to 4, the flag is set as 1. If it is greater than 4, the flag is set as 0. This number (4 in our case) can be modified based on:-
Station and number of customers using the station
Traffic at that hour of day
Since we have historical data (and we can look forward an hour), and a practical application of this would probably be in real time data, the parameter will have to be built differently in that case. Some considerations are:-
Traffic volume for the time stamp based on historical values
Historic number of available bikes at the time stamp – also considering time/day/month – similar to our parameter
Forecasting: We can conduct a simple forecasting trying to predict the number of bikes available at the hour of the day. Initially this forecasting will be done to check its accuracy. If it is fairly accurate, we can build a model based on it.
Note: This forecasting can be continuously improved over time even if its not accurate initially, by replacing the forecast with actual data.
Once the forecast is accurate enough, our model accuracy will improve as well.
Data Import and Cleaning
There were some issues with the timestamp formats in the data which have been handled in the code Apart from that, the data was relatively clean and did not require extensive manipulations.
Exploratory Data Analysis using Data Vizualizations
Exploratory data analysis has been done by using the following packages:-
matplotlib for graphs and charts related to the predictive models
seaborn for exploratory data analysis
matplotlib has been used more extensively as seaborn resulted in slower rendering of the graphs because of the size of the dataset. Below are some of the visualizations done based on the data set available. They give us a fair idea of the traffic on station 70 through out the time period.
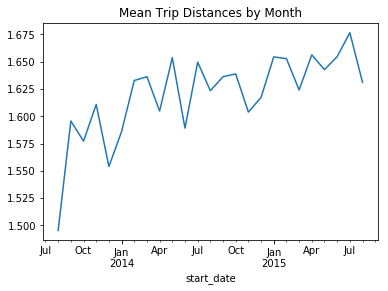
Trip distances show an overall increasing trend throughout the time period suggesting that the number of users is growing
Monthly distances clearly show an increasing trend. Notice the drops in the months around January and July which are the coldest and warmest months of the year suggesting the drop in active users during these months
Weekly trip distances show a more detailed picture.
Apart from trip distances, number of trips have also been explored. The mean trip durations have also been explored for the data. Seasonality can be observed in the data for all these observations.
I
It’s interesting to notice that the trip durations during the months of July and January are the highest. Which is a strange observation because the trip distances were low during these months. This may suggest users not returning their cycles for long periods of time on the same trip. They might be staying indoors for long periods of times.
The above conclusion can be verified based on weekly numbers. Notice the spikes for January and July
Number of trips show drops only for winter months.
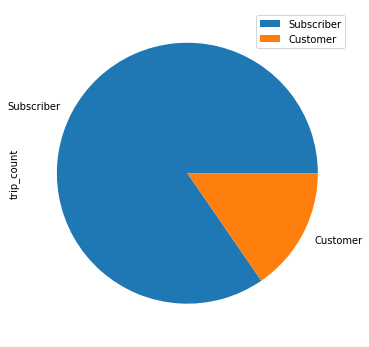
Subscriber are the ones who make the majority of trips.
Understanding the Traffic
Understanding the traffic patterns is important in feature building. Traffic is the key element of our data set and it will be used to build features which will help us predict whether the docking station needs additional bikes or not.
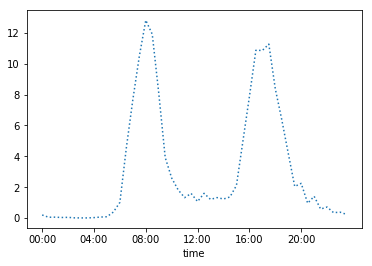
Below is a graph which shows the net number of bikes at any given time on the docking station 70. The number of bikes in play have been totalled and we have calculated the mean across the time period and plotted it against the time of the day. This clearly shows which time periods have the highest and lowest traffic.
Y-axis: Net number of bikes in play It is clear that traffic is the highest around 8.00 AM in mornings and 5.00 PM.
It is evident that the traffic peaks in the mornings and evenings. This suggests:-
A large number of people leaving and coming in during the morning (around 8.00 AM) and evening (around 5.00 PM) hours.
The traffic pattern suggests the docking station is in an area which has both residences and offices.
This also tells us that these hours are the time when the docking station will need replenishment the most frequently.
Below, we have done a similar analysis for traffic for the day of the week. 0 being a Monday and 6 being a Sunday. There are no surprises here. The traffic peaks on Wednesday’s and drops sharply on the weekend.
Weekdays (0 – Monday, 6 – Sunday)
Based on the analysis above, additional features were developed in order to take these factors into consideration. For example:-
net_incoming_overall_by_hour: This feature gets the mean of the net incoming traffic (no. of incoming bikes – no. of outgoing bikes), by hour of the day. The mean is taken across the complete data set for each hour of the day.
net_incoming_overall_by_weekday: Similar to the above feature except instead of hour of the day, the day of the week is considered.
net_incoming_traffic_ratio_1: Ratio of the mean of the net incoming traffic in the last 24 hrs vs the net_incoming_overall_by_hour for the specific hour.
net_incoming_traffic_ratio_2: Ratio of the mean of the net incoming traffic in the last 24 hrs vs the net_incoming_overall_by_weekday for the specific weekday
With these features, we aim to consider these factors within our data model.
Machine Learning Models
Since I have structured this as a classification problem after time series analysis, I chose the following models. These are the most commonly used classification models and having passed the datasets to them, I have compared the results with each other to identify the best model.
K-Nearest Neighbours
Decision Tree Classification
Random Forest
Model Evaluation
Model evaluation is done based on the following parameters:-
Accuracy
ROC curve
Precision
Recall
Accuracy of the models is important in this scenario along with precision and recall. Our aim is to minimize false positives (precision) and false negatives (recall) while also having a high accuracy.
Precision-Recall Curves:-
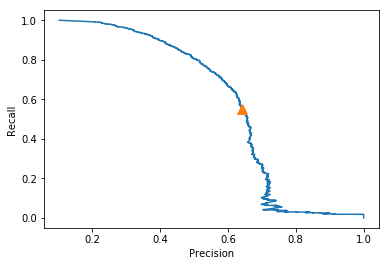
kNN Precision Recall Curve
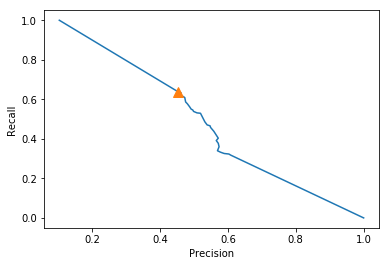
The precision recall curves have been displayed here. It can be seen that the precision-recall for kNN is definitely better than that of the decision trees model. Although decision trees has a higher recall value, kNN outscores it as far as precision is concerned, which is more important for out case.
Decision Trees: Precision Recall Curve
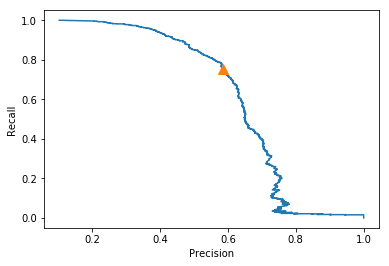
Below is the precision recall curve for the random forest classifier. We can see that it is more balanced that the previous two models. It has a higher precision that decision trees and a higher recall than both decision trees and kNN.
One key objective is to reduce the number of false negatives as much as possible. To achieve this, different probability thresholds have been tried for different models. The best one is identified based on the the minimum number of false positives and false negatives. False positives can be tolerated (to an extent) because that would mean providing additional cycles to a station when they are not actually needed. However, a scenario where this happens is more acceptable than losing customers to other competitors in case our stations do not have cycles for the customers.
Model Name
False +ve (1 as 0)
False -ve (0 as 1)
Model Accuracy
kNN
334
485
91.3%
DT
831
394
88%
RF
575
270
91.4%
As far as the false positives and false negatives are concerned, its upto the business to decide which factor is more important. False positives mean 1 classified as 0. In this scenario, it would mean a replenishment flag (station needs additional bikes) classified as a no flag (station does not need bikes). This may result in loss of customers as they will find no bikes in the station.
However, is this opportunity cost higher than the cost of sending bikes to a location when the docking station has a sufficient number of bikes (false negative – 0 classified as 1) ? Maybe the cost of transporting bikes and then leaving without replenishing the bikes or waiting at the station for docks to be empty, is higher than losing a customer ?
This is a question for another analysis if we have other data, like the opportunity cost or cost to replenish a bike on the station.
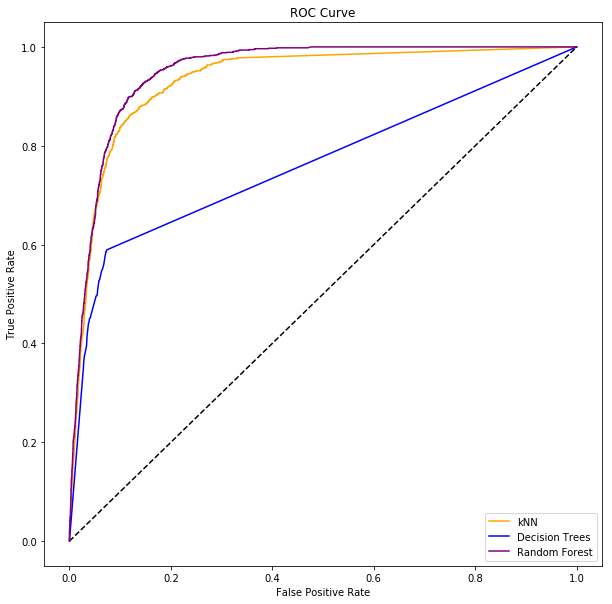
ROC curve for all three models
Based on the ROC curve, we can conclude that the Random Forest model is the best for our scenario. It covers the most area under the curve. kNN is not far behind either. Perhaps, if we want to reduce the number of False Positives, kNN is the better model.
Assumptions and Limitations
This is my first attempt at working on a relatively complex time series data set. In the past, I have seen time series data which have been analysed to identify trends and patterns. However, predictions with time series data is new. In order for the target variable to be available, we will have to forecast incoming and outgoing traffic which can be done fairly easily on a time series data set. Our target variable can then be used to predict where bicycles will be needed.
Assumptions
There are many assumptions in this case:-
The forecasts for the bycycle traffic need to be fairly accuate. This is possible with the data available to us. More data can possibly make it more accurate to figure it out.
The dock sensors, which identify whether a bicycle has been taken out of the dock are fairly accurate, fast (sending data instantaniously) and reliable (low failure or error rates)
For our model building, I have assumed the minimum number of bicycles which trigger the flag as 4. This number can be changed though.
Limitations
Our target variable depends on forecasts. If an unseen event or change in traffic effects the forecast, our target variable also gets effected.
There is much more data which can be gathered regarding the docs and customers or subscribers. This can help in building a better model but is not available to us. For example, if we have subscriber data, we can forecast with great accuracy which subscribers are likely to take a bike and this helps in traffic predition.
Conclusion and Client Recommendation
As a consultant working with the client, my recommendation, based on the analysis would be to use the Random Forest model in order to most accurately predict the when the station will need replenishment of bicycles. This recommendation has been reached based on the different metrics used to measure model performance.
The Random Forest model results in the highest accuracy and the lowest false positive and false negative rates which we are trying to reduce.
The Random Forest model is also ideal for data sets with mixed features.
The model can be exposed as a web application in which similar data sets can be passed to obtain results however, the best way to use it would be to train any new data set.
I would recommend the client to use similar modelling for all the other station data available. This model would be best suitable for the stations with the highest traffic.
Future Research
Including subscriber data along with dock status and traffic information
Combining all station data and running on a cluster(s)
Building a live dashboard based on the incoming data – or a dashboard based on available data
Application layer
An application can be built which can let us manipulate parameters (like bicycle threshold/ subscriber information/ special events – like holidays etc. )
The application layer will enable us to change the predictions on the go if we are able to base our prediction on a movable window of time.
An application layer which checks in real time the accuracy of our forecast and allows for changes to tweak it.
Applications in other similar industries
Apart from bike sharing, similar algorithms and methods can be used in other crowd-sharing scenarios like scooter sharing, equipment and services rentals, etc.
In the winter of 2014, my uncle forwarded me a video of him sitting in a Tesla Model S reading a magazine as the car drives itself on a dark road at a speed of about 50 MPH. I can see the car changing lanes and adjusting its speed so as not to crash into the car in front of it. All this while, my uncle continues (to pretend) reading his magazine. I know he is not, because the magazine is upside down. His one eye is still on the road and he is nervous but he is in no way involved in driving the car. It was driving itself. I remember my reaction to the video. I believe I said, ‘Wow, thats cool’. But I did not dwell on it further. Cool gimmicks of expensive toys. Fast forward three years. I am sitting in my office looking at a company wide demo for robotic process automation, or RPA. I see how a computer program fills out around a hundred data entry forms automatically, after reading relevant data from a hundred hand written forms scanned into the program. An activity which took a person around 90 hours to do was done by the machine in 9, without any errors. Even if there was an error, the next time it was certain that the error would not be repeated. This time, I didn’t say, ‘Wow, that’s cool’. This time I started looking for online courses to learn more about similar technologies. My heart rate was slightly elevated and I felt that my resume needed to be strengthened. This time, I felt a slight churn in the bottom of my stomach. The machines are coming.
Artificial intelligence is a system’s ( a machine’s) ability to correctly interpret external data and/or information, use it and learn from it in order to achieve its goals. This is the simplest definition. Intelligence is a feature we associate with animals (including humans). Artificial intelligence is when a machine demonstrates this animal capability.
We cannot be sure when the term came into being. It was definitely popularised by science fiction stories in which robots or automatons of some kind develop human like intelligence and demonstrate the ability to feel and emote. The term has been demonised and glorified in equal measure, however, the demonization generally tends to stick with us. How many AI centric science fiction movies do you remember where the robots are NOT trying to kill the humans ?
We are nowhere near that stage though. Our best AI programs are either limited to accomplishing tasks in a narrow field, like driving cars or trucks and controlling airplanes or they are analytical AIs which learn from past experience and predict outcomes which are affected by a limited range of parameters. But this doesn’t mean that there is no need to be alarmed. Here is one story which should give you a fair idea of how fast things are progressing.
StockFish 8 is a chess playing computer program which has years of practice defeating chess players, nay, champions from all over the world. It was trained in a multitude of chess strategies by the best computer programmers in the world. It has consistently been ranked as the most powerful chess computer program in the world. Based on the the hardware available to it, it can scale up or scale down its level. Now let’s introduce our protagonist (antagonist?) Enter, AlphaZero. An algorithm which is self trained (played only against itself). It’s a neural network based algorithm which was able to train itself in 4 hours, to surpass the levels of StockFish 8. In a 100 match competition with StockFish 8, AlphaZero won 28 games, drew the remaining 72. Add up the numbers. Its 100 games. No losses. 4 hours. It took 4 hours to beat the best chess playing computer in the world, without any human help whatsoever. Did a tingle just run down your spine?
Sensationalism always sells. It’s more popular than hope. Which is why, for many people outside the scientific community, AI is, either a threat which needs to be taken care of immediately, or its still in its infancy and poses absolutely no threat. Both the viewpoints are wrong. AI hold promise too. It is being used to revolutionary effects in the medical field in helping decode the genome, identifying genes which cause life threatening diseases and even predicting the next flu outbreak helping scientists and medical professionals prepare. AI hold promise in so many other fields. It is already being used as a fraud prevention tool in the finance and banking sectors. AI can one day replace mundane jobs like bank tellers, supermarket cashiers and bus conductors. Introduced within robots, AI can replace other mundane jobs like janitors and cleaners. Such robots may one day perform dangerous tasks like bomb defusal and working with radioactive wastes and putting out dangerous forest fires. AI has the potential to revolutionize farming. Even in the area of arts, AI has shown promise, both as an artist (AI generated paintings and AI created songs) and as a tool (detecting fraudulent paintings)
But while the promise paints a future perfect picture, there is an ugly side of AI as well. Surprisingly, it’s not the AI’s fault. Just like any machine we humans have built, AI serves our purposes. For example, an AI which detects fraudulent transactions for a bank, does so to increase the bank’s profits by reducing costs. Similarly, robots which automate a factory floor, don’t do so on their own volition. They do not think that this will reduce human injury. They do so, because a human made the decision to set them up in order to increase his or his company’s profit, by cutting down on costs. Let’s consider a scenario. If tomorrow, Amazon or Google come out with a machine which can replace the human cashier in supermarkets, for a one time investment of 100,000, but will enable the stores to remain open 24*7, throughout the year, will not ask for health or dental benefits and will never take a day off, all retail companies will clamour to get their hands on it. Overnight, the world’s cashiers will be out of jobs! It crueler than it sounds. Why? Because we, the middle class, will not be immediately impacted. We might be glad that the stores now remain open 24 hours and we don’t have to make small talk with the person on the cash register. Now imagine an AI which can do better business analysis then you. Imagine an AI which can code better than you. Imagine an AI which can read spreadsheets better than you. Imagine an AI, which can do you job better than you. You get the picture. Chances are that such an AI is already being developed by someone.
So how can we get the most benefit out of AI? The answer is simple. By focusing our attention on the ‘WE’ in this question. How can ‘WE’ …. We have to expand our circle of inclusion. We have to look beyond ourselves, look beyond our family, our community, our city, our country and consider the humanity as a whole. Can we let the machines take over our mundane jobs while we make sure that the people these machines replace can come out of their poverty traps ? Can we make sure that people in third world countries are able to access AI doctors which prescribe them the right medicines for free, without letting actual doctors feel worthless? Can we build cars in a person-less factory while making sure people are still going to be able to afford them ?
WE have to tell our government’s to focus on such questions. WE have to make our business leaders and entrepreneurs think about such questions. We have to think about such questions every day. Before we worry about AI making humanity extinct, we have to worry about AI making humanity irrelevant. And WE have to do it fast. Because it took a machine 4 hours to be the best at chess …. the best ever. It may take just a few more for the machine to be best at everything and make us all irrelevant.